
This post summarizes key findings from our article How Long and What For? Tracking a Nationally Representative Sample to Quantify Internet Use published in the Journal of Quantitative Description: Digital Media. Read more about this new journal here.
The internet is increasingly used across multiple devices, often on the go, and very much integrated into everyday activities rather than being a discrete event with a clear beginning and end point. Consequently, and in addition to long-known biases, measuring internet use has become more challenging and harder for respondents to self-report.
Valid “baseline” measures of how much time people spend online and using specific services are needed to test models of internet use effects. We provide a quantitative description of internet usage time overall and of popular services across devices and social groups. For example, if we are interested in causal processes leading to online harms, we first need to descriptively know what the basic use/exposure looks like: Are there differences between adolescents and older adults? Are YouTube and Facebook used more on smartphones or computers?
Platform data or sources like Statista are often inadequate: Social research needs sociodemographic attributes and other covariates at the person level. Thus, how can participants’ internet use be measured along with relevant further variables? Traditionally, quantitative media use research relies on self-reports collected in web, phone, or face-to-face surveys. “On a typical day, how much time do you spend online? On WhatsApp?” This can introduce biases such as recall issues, variance in interpretation, or social desirability. Tracking, passive metering, logging — the idea of taking advantage of the digital devices ability to record user behavior is a promising and complementary new measurement approach (albeit being subject to its own specific challenges).
This study is unique in that it uses a nationally representative sample of >900 participants who completed a survey and had their internet use tracked for one month, both on their mobile device (smartphone or tablet) and on their computer (desktop or laptop).
The tracking software ran in the background and logged all URLs visited in a web browser as well as apps used with time stamps (what is not available is in-app content). This resulted in >13 million tracked use events, e.g. searching something on Google or opening WhatsApp. For overall use time, the pattern of differences between age and educational groups were similar across self-reported and tracked time, yet at a different level: tracked use time was only about half of self-reported use time (triangles=survey, circles=tracking).
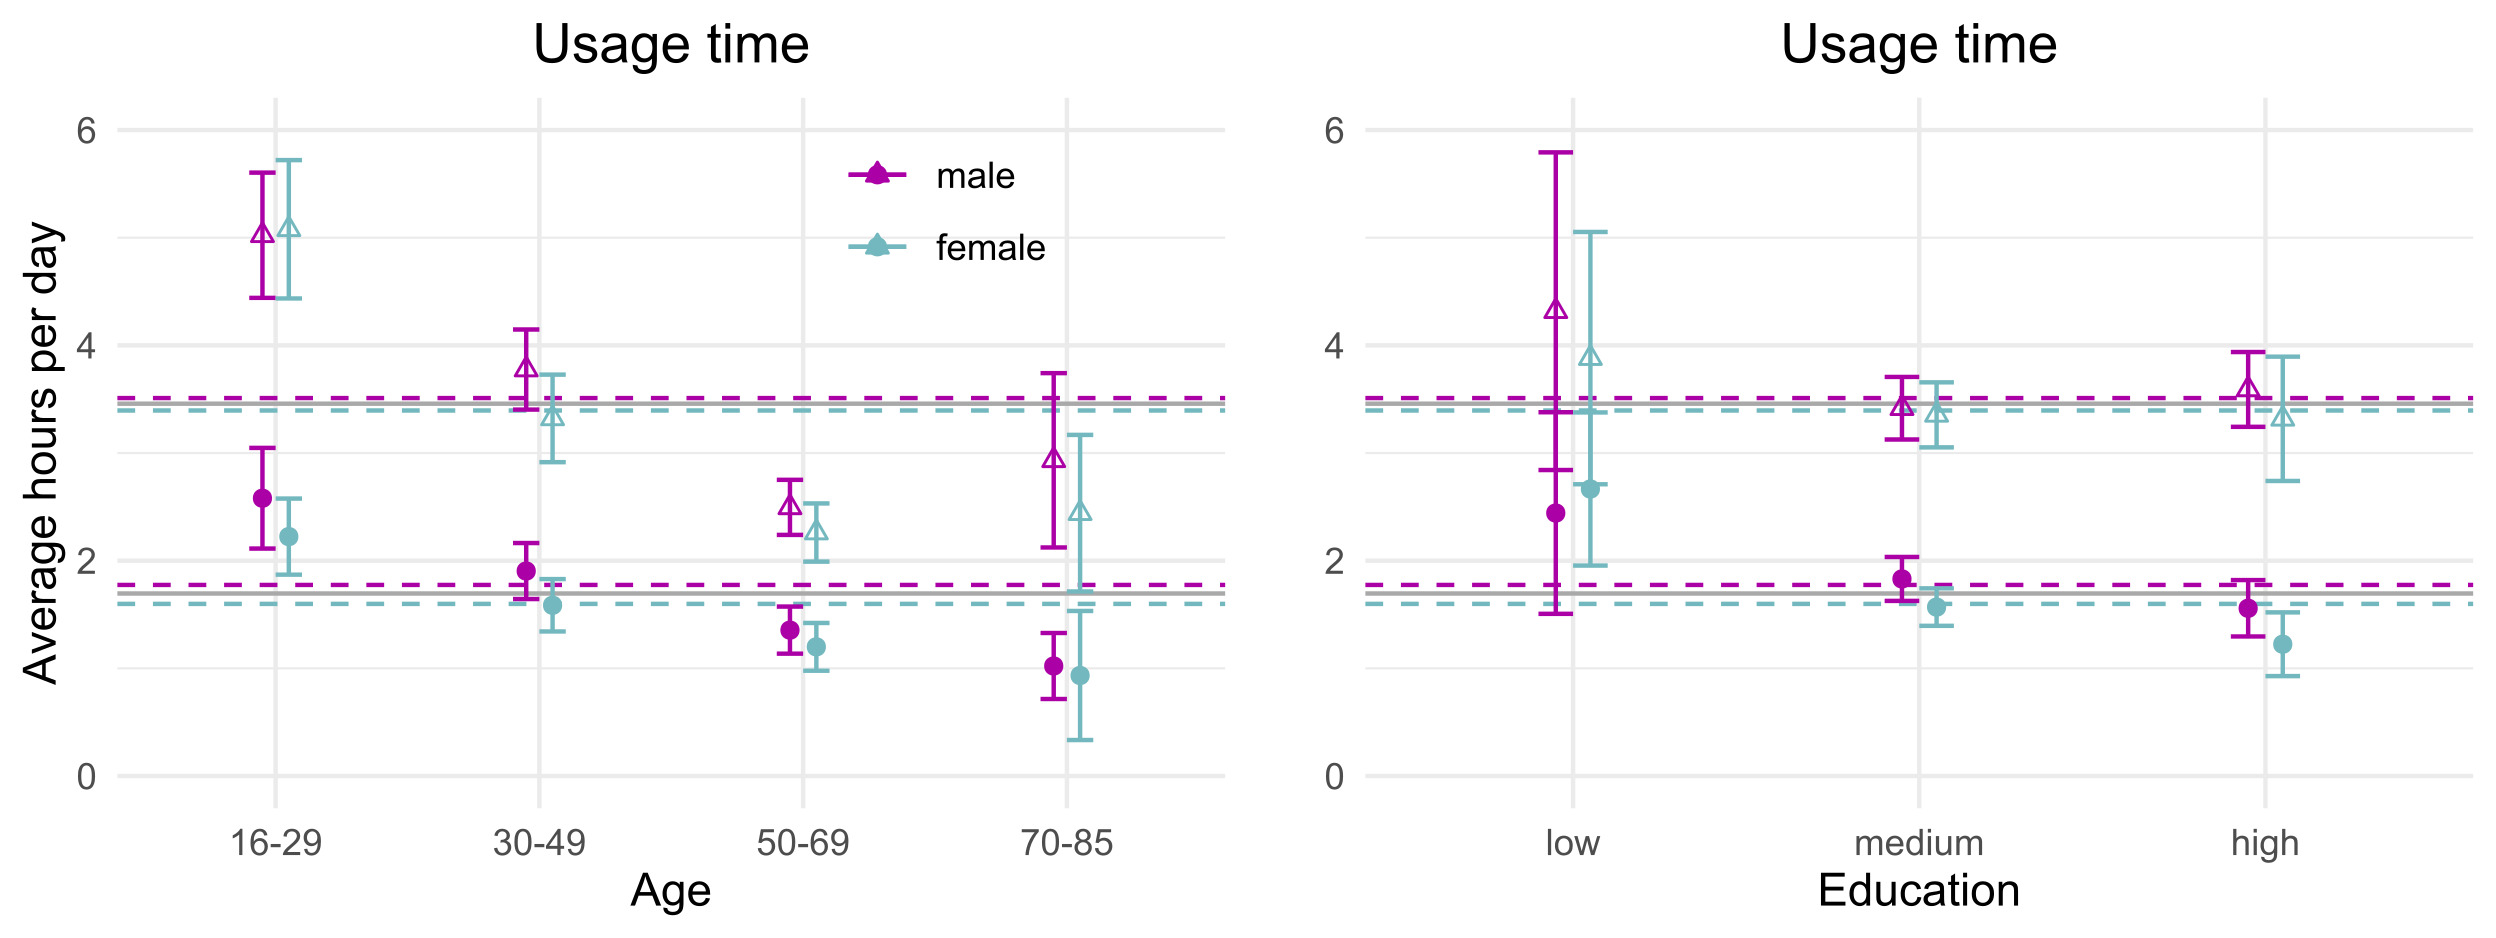
From the tracking data: average use per day was 3 hours for young respondents (16-29) compared to 1 hour for older users (aged 70+). Gender differences were minimal. With 80% of overall use, mobile usage time was highest for 30 to 49 year olds. What are the most “mobile” services? Unsurprisingly, WhatsApp had 99% mobile accesses and was used the longest on average with 13 minutes per day. YouTube was the only service used more on desktop/laptop devices (55% non-mobile). Google search was about even with 52% of use events on mobile devices.
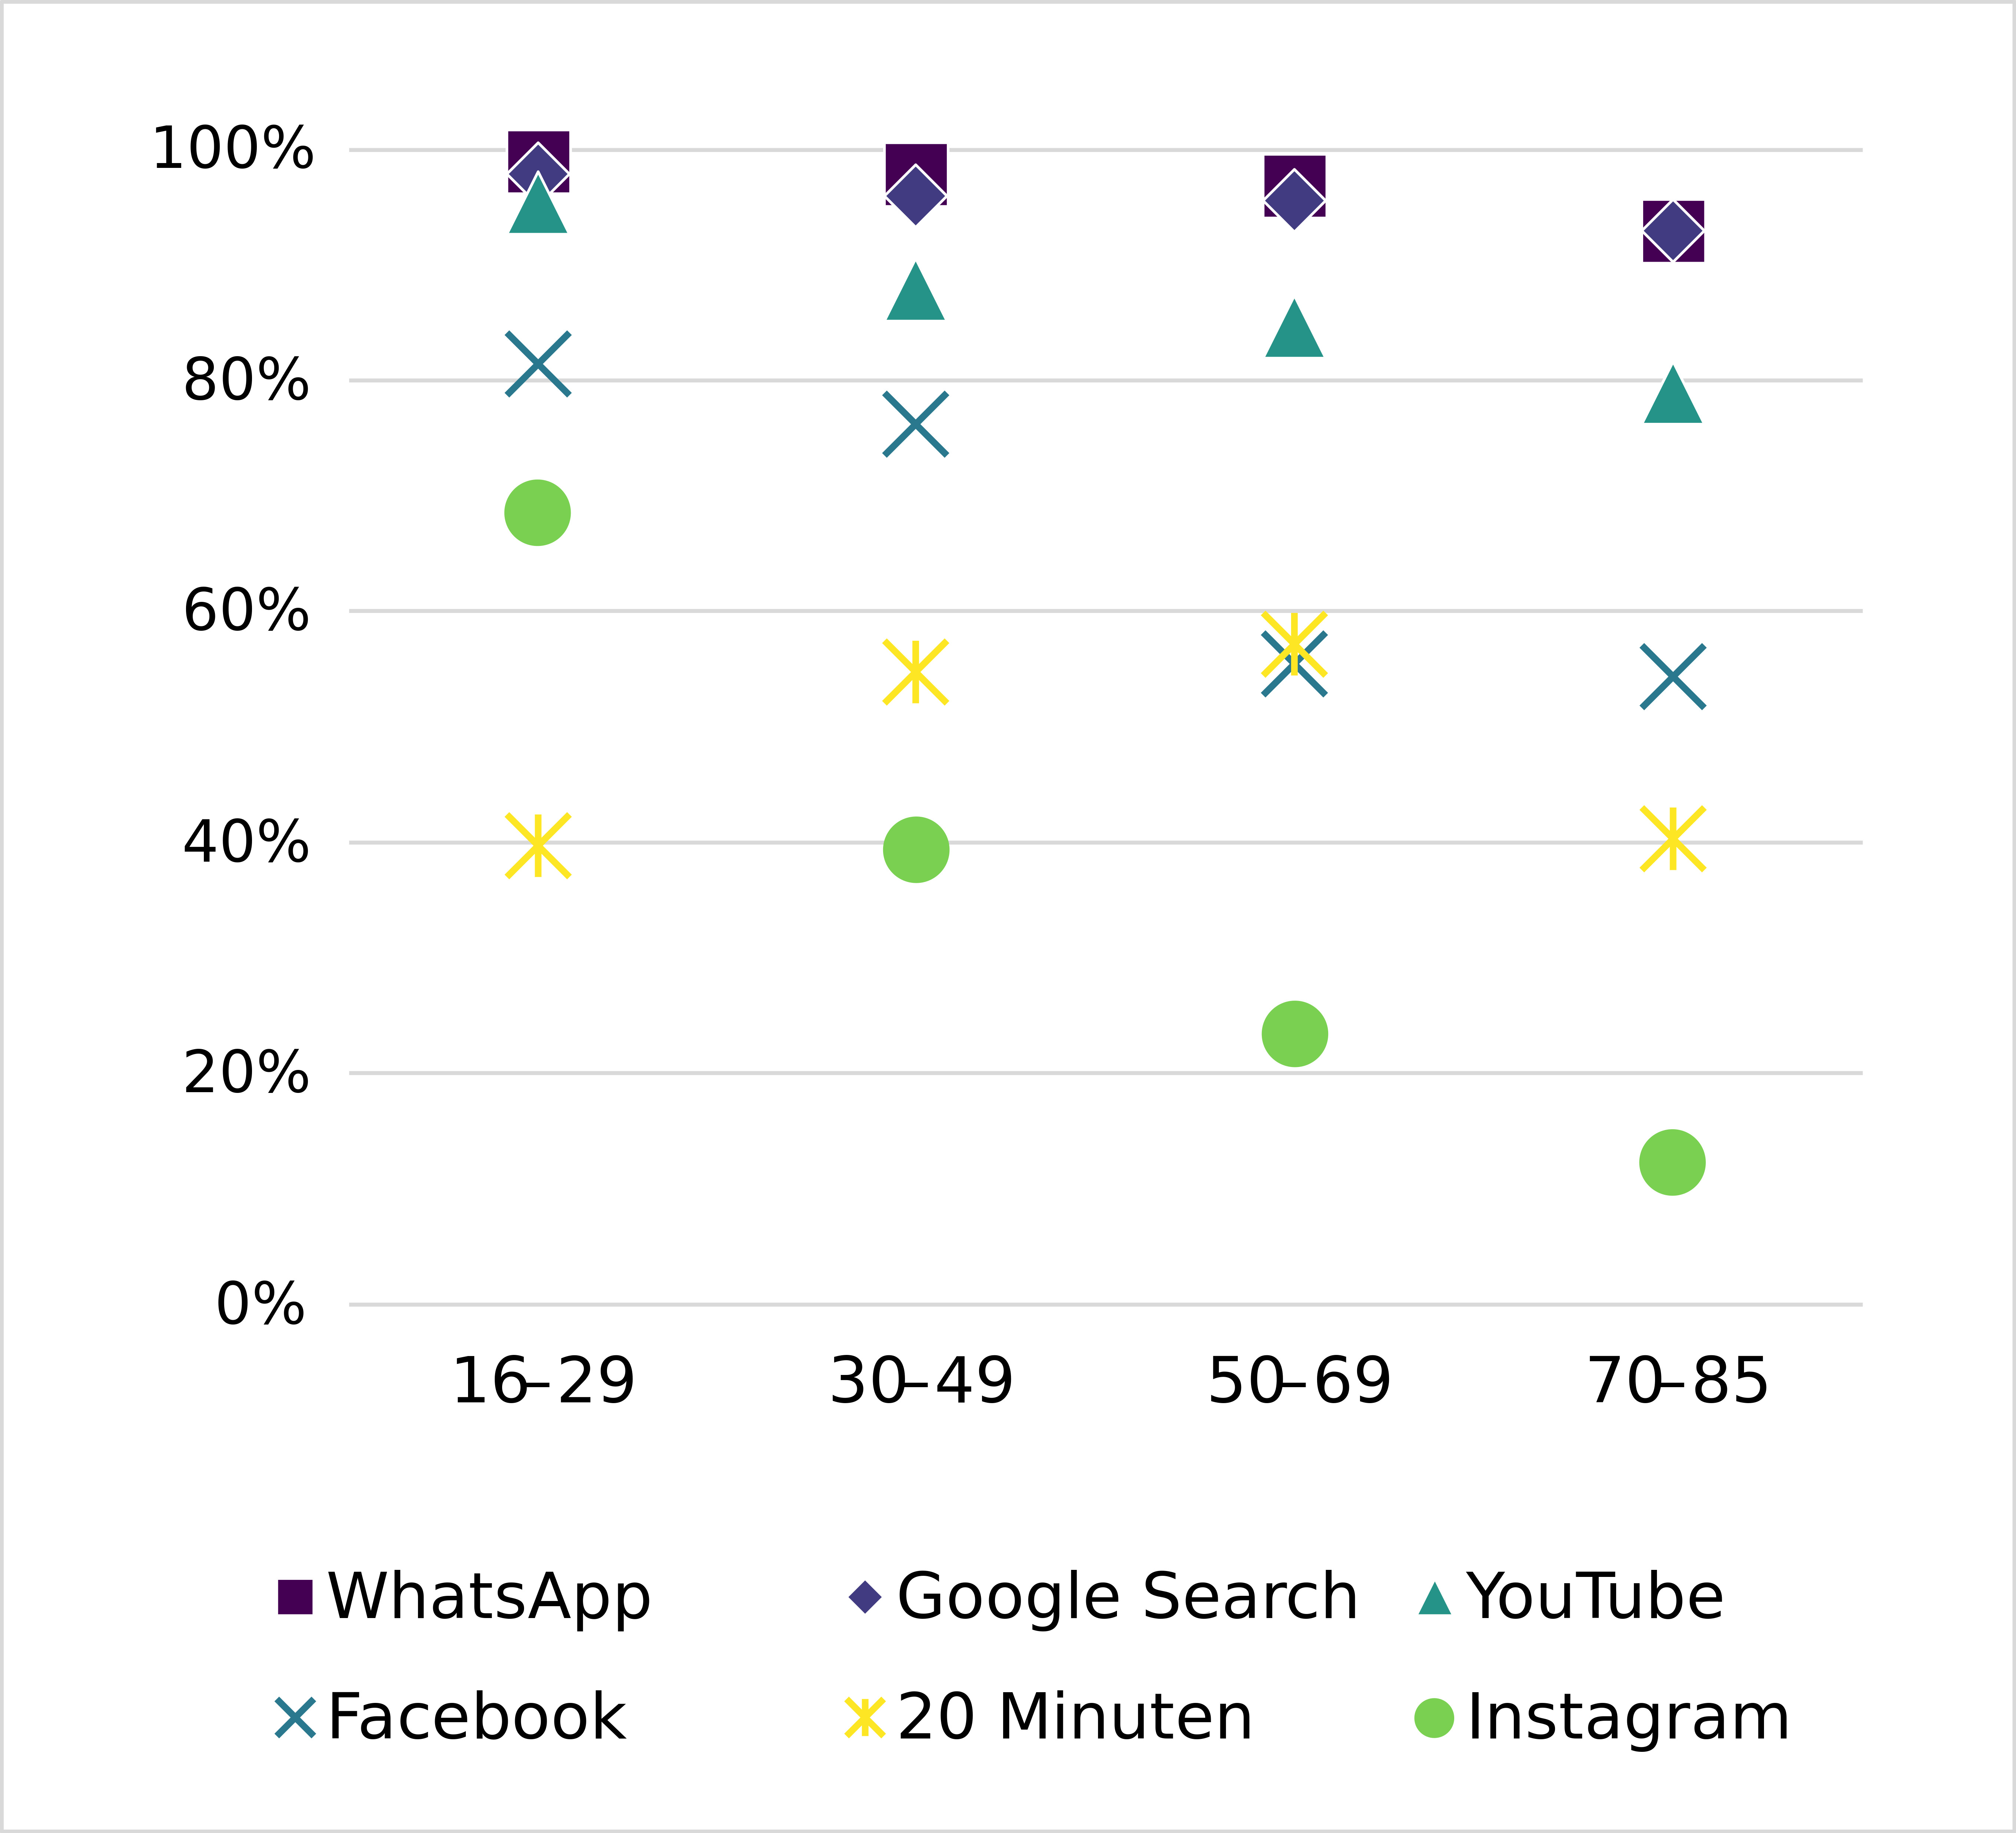
How many people of what ages even use these popular services? Younger people are more likely to use social media services. Only news (20 Minuten) had the highest user percentage among middle aged people.
| User group | % mobile accesses | M usage time(minutes per day) | SD usage time(minutes per day) | |
| 97.51 % (N = 900) | 98.64% (N = 1’252’757) | 13.23 | 34.53 | |
| Google Search | 96.10% (N = 887) | 51.62% (N = 474’614) | 3.28 | 8.65 |
| YouTube | 87.87% (N = 811) | 45.06% (N = 183’510) | 11.91 | 32.55 |
| 69.34% (N = 640) | 60.81% (N = 353’720) | 9.42 | 26.37 | |
| 20 Minuten | 51.44% (N = 475) | 91.92% (N = 124’545) | 3.46 | 10.17 |
| 38.79% (N = 358) | 93.37% (N = 219’499) | 5.08 | 14.66 |
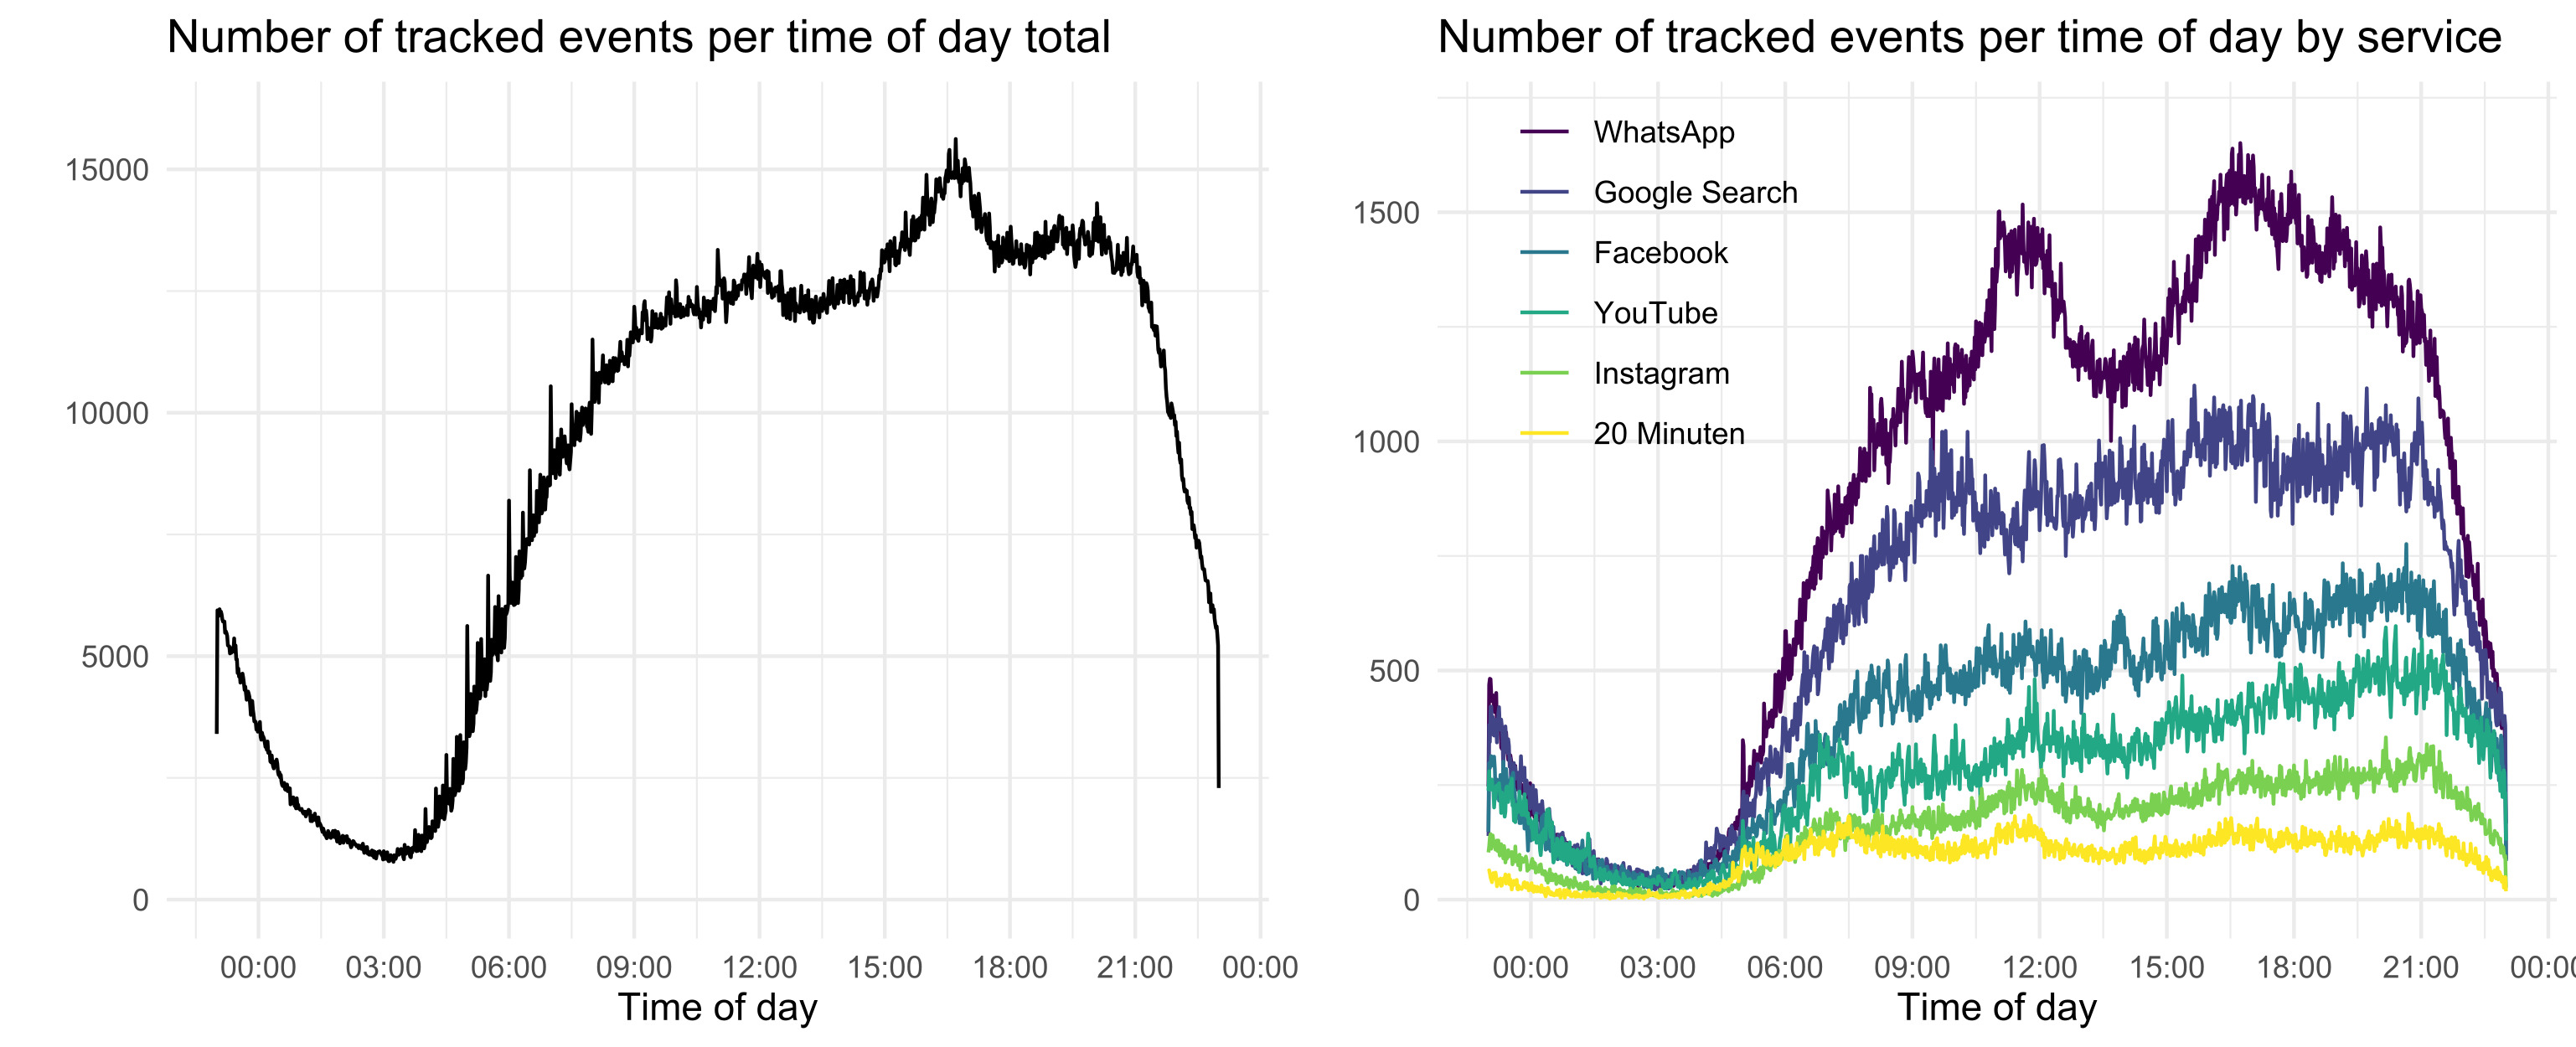
There were generally only small differences in usage time between age groups among the users of a service. Participants in all social groups spent the majority of their online time on a mobile device. Over the course of a day, the major services varied in their frequency of use: for example, messaging peaked before noon and in the late afternoon, whereas online news use was comparably constant at a lower level.
Despite the benefits, gathering and analyzing tracking-data is resource-intensive in many ways, particularly when data is collected over a long time span, for a representative sample, and for multiple devices. Whereas measuring what is supposed to be measured (e.g., time spent on an app) may be more error-prone in survey data (e.g., due to self-report biases), analyzing what is supposed to be analyzed may be more error-prone in tracking data.
The study results provide a promising methodological and empirical basis for answering various questions about digital media use and consequences in the future, especially when considering that any empirical data is a selective and incomplete depiction of reality.
R code: https://osf.io/j5mhn/?view_only=7e82e560f19945d4bbbae168cbbcde3e
