If you assume there are 5 jobs available for a pool of N candidates, luck will play a more important role in determining success, i.e., being selected for the job, the larger N is. Here is a simulation example in R adapted from this video.
Let’s assume a candidate’s “true score” can be objectively assessed by the selection committee, but how this score originated is 90% skill and 10% luck. I am further assuming that luck and skill are uniformly distributed here and that luck ranges from 0 to 100, whereas skill ranges from 50 to 100 (reflecting the idea that those with low skills don’t even apply):
skillrange <- 50:100
luckrange <- 0:100

# number of candidates, try different numbers
ncand <- 10
ncand <- 100
ncand <- 1000

# set up an empty data frame to fill with simulated data
df <- as.data.frame(matrix(NA , nrow = ncand, ncol = 4))
Next, I’m generating a random skill and luck score for each candidate and adding them up in the 90:10 ratio. You can try different values of course.
# loop through all candidates and generate a random skill and luck score for each
for (i in 1:ncand) {
  df[i,1] <- sample(x = skillrange, size = 1)
  df[i,2] <- sample(x = luckrange, size = 1)
}

# calculate a candidate's total score
# weighted as 90% skill and 10% luck (try different numbers)
df[ , 3] <- 0.9 * df[ , 1] + 0.1 * df[ , 2]

# rename the columns/variables
names(df) <- c("skill", "luck", "score", "selected")

# number candidates
df$cand <- 1:nrow(df)
Assuming now that there are 5 jobs available, I’ll call those “selected” and compare their skills and luck to those of the candidates not selected.
# order the data according to score, highest at the top
df <- df[order(df$score, decreasing = T) , ]
# set the top five as selected
s <- 5
df$selected[1:(s+1)] <- "yes"
df$selected[(s+1):nrow(df)] <- "no"
# label as "lucky" if luck is in 75th quantile
df$lucky <- "no"
df$lucky[df$luck > quantile(df$luck, probs = .75)] <- "yes"
# label as top skilled if skill is 99 or 100 out of 100
df$topskill <- "no"
df$topskill[df$skill >= 99] <- "yes"
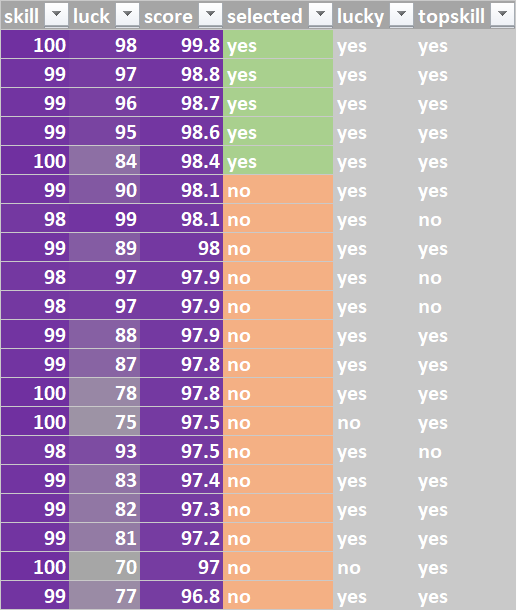
# look at top 20, of which top 5 are selected
head(df,20)
# compare luck and skill levels between selected and not selected candidates
par(mfrow=c(1,2))
plot(df$skill ~ as.factor(df$selected),
xlab = "Selected", ylab = "Skill",
main = paste0("Number of candidates = ", ncand))
plot(df$luck ~ as.factor(df$selected),
xlab = "Selected", ylab = "Luck")
The entire analysis could be packed into another loop and run e.g. 1000 times to see the long-run differences (because the numbers will vary quite strongly for a single run of the simulation, especially for small N); the picture emerging is that when the candidate pool is large, those that succeed will (as expected and sensibly) have very high skills, but are also very luck. Many non-selected candidates with equal or even higher levels of skill than some of the selected 5 just weren’t lucky.