
In this episode of the Quantitude podcast, the hosts discuss the sometimes very unintuitive nature of probabilities. The well-known birthday problem asks what the probability is that any two people in a group have the same birthday. Obviously, this depends on the group size: if two randomly selected people meet, it’s very unlikely that they have the exact same birthday. However, if you had a group of 70 people, that probability is 99.9%! (Importantly, it is not about one of those people sharing your birthday, or any two having one specific birthday; just that any two have the same birthday).
To figure out these probabilities, it makes sense to reverse the problem: if you pick 1 day out of 365, the probability that the next person does not share that birthday is 364/365; their birthday can be on any day except on the one day that’s already “occupied”. For the next person, we get 363/365 and so on. Because for all people in the group this has to be simultaneously true, these probabilites need to be multiplied. And because we reversed the question, this whole multiplication of probabilities needs to be subtracted from 1 (i.e., 100%), to get the answer to the original question.
In R, a vector with all the integers from 1 to n can be very conveniently constructed (1:n), and if you use such a vector in calculations involving constants, you will get the result for each value of the vector:
(366 - 1:5) / 365
[1] 1.0000000 0.9972603 0.9945205 0.9917808 0.9890411
Using this vectorization within the prod() function thus multiplies all the individual probabilities together to get the answer for a specific group size (by also substracting from 1), in this case a group of 5:
1 - prod((366 - 1:5) / 365)
[1] 0.02713557
I actually find the code snippet below more intuitive. It is longer but produces the exact same result by sticking to 365 days in a year (and we are not dealing with leap years in this example): this way it is clearer that we are subtracting the possible birthday for “all the others”, which is no one (i.e., 0) in the case of a group size of 1.
1 - prod((365 - 0:(n-1)) / 365)
The calculation can be looped such that we calculate the probability for each group size between, for example, 1 and 75:
results <- tibble()
for (n in 1:75) {
  prob <- 1 - prod((366 - 1:n) / 365)
  new <- tibble(n = n, prob = prob)
  results <- bind_rows(results, new)
}
This doesn’t produce any output, it just saves everything in the results tibble which has two columns (n for the group size and prob for the probability).
The next step is the visualization with ggplot2 and a quick addition of an indicator column for the two thresholds of interest (i.e., at which group size do we exceed 50% and 99% respectively):
results <-
  results |> mutate(line = if_else(floor(100 * prob) == 50 |
                                   (floor(100 * prob) == 99 & 100 * prob < 99.1),
                                   TRUE, FALSE))

results |>
  ggplot(aes(x = n, y = prob)) +
  geom_line(linewidth = 1, color = "gray30") +
  scale_y_continuous(labels = label_percent(scale = 100),
                     n.breaks = 10) +
  scale_x_continuous(breaks = seq(2, max(results$n), by = 2)) +
  geom_vline(data = results |> filter(line == TRUE),
             aes(xintercept = n), color = "blue", linetype = 2) +
  geom_hline(data = results |> filter(line == TRUE),
             aes(yintercept = prob), color = "blue", linetype = 2) +
  geom_point(data = results |> filter(line == TRUE),
             size = 5, shape = 4, color = "blue") +
  theme_minimal()
The figure shows the group size on the x axis and the corresponding probability that at least two people share a birthday on the y axis; the blue dashed lines at n = 23 and n = 57 indicates where 50% and 99% are first exceeded:
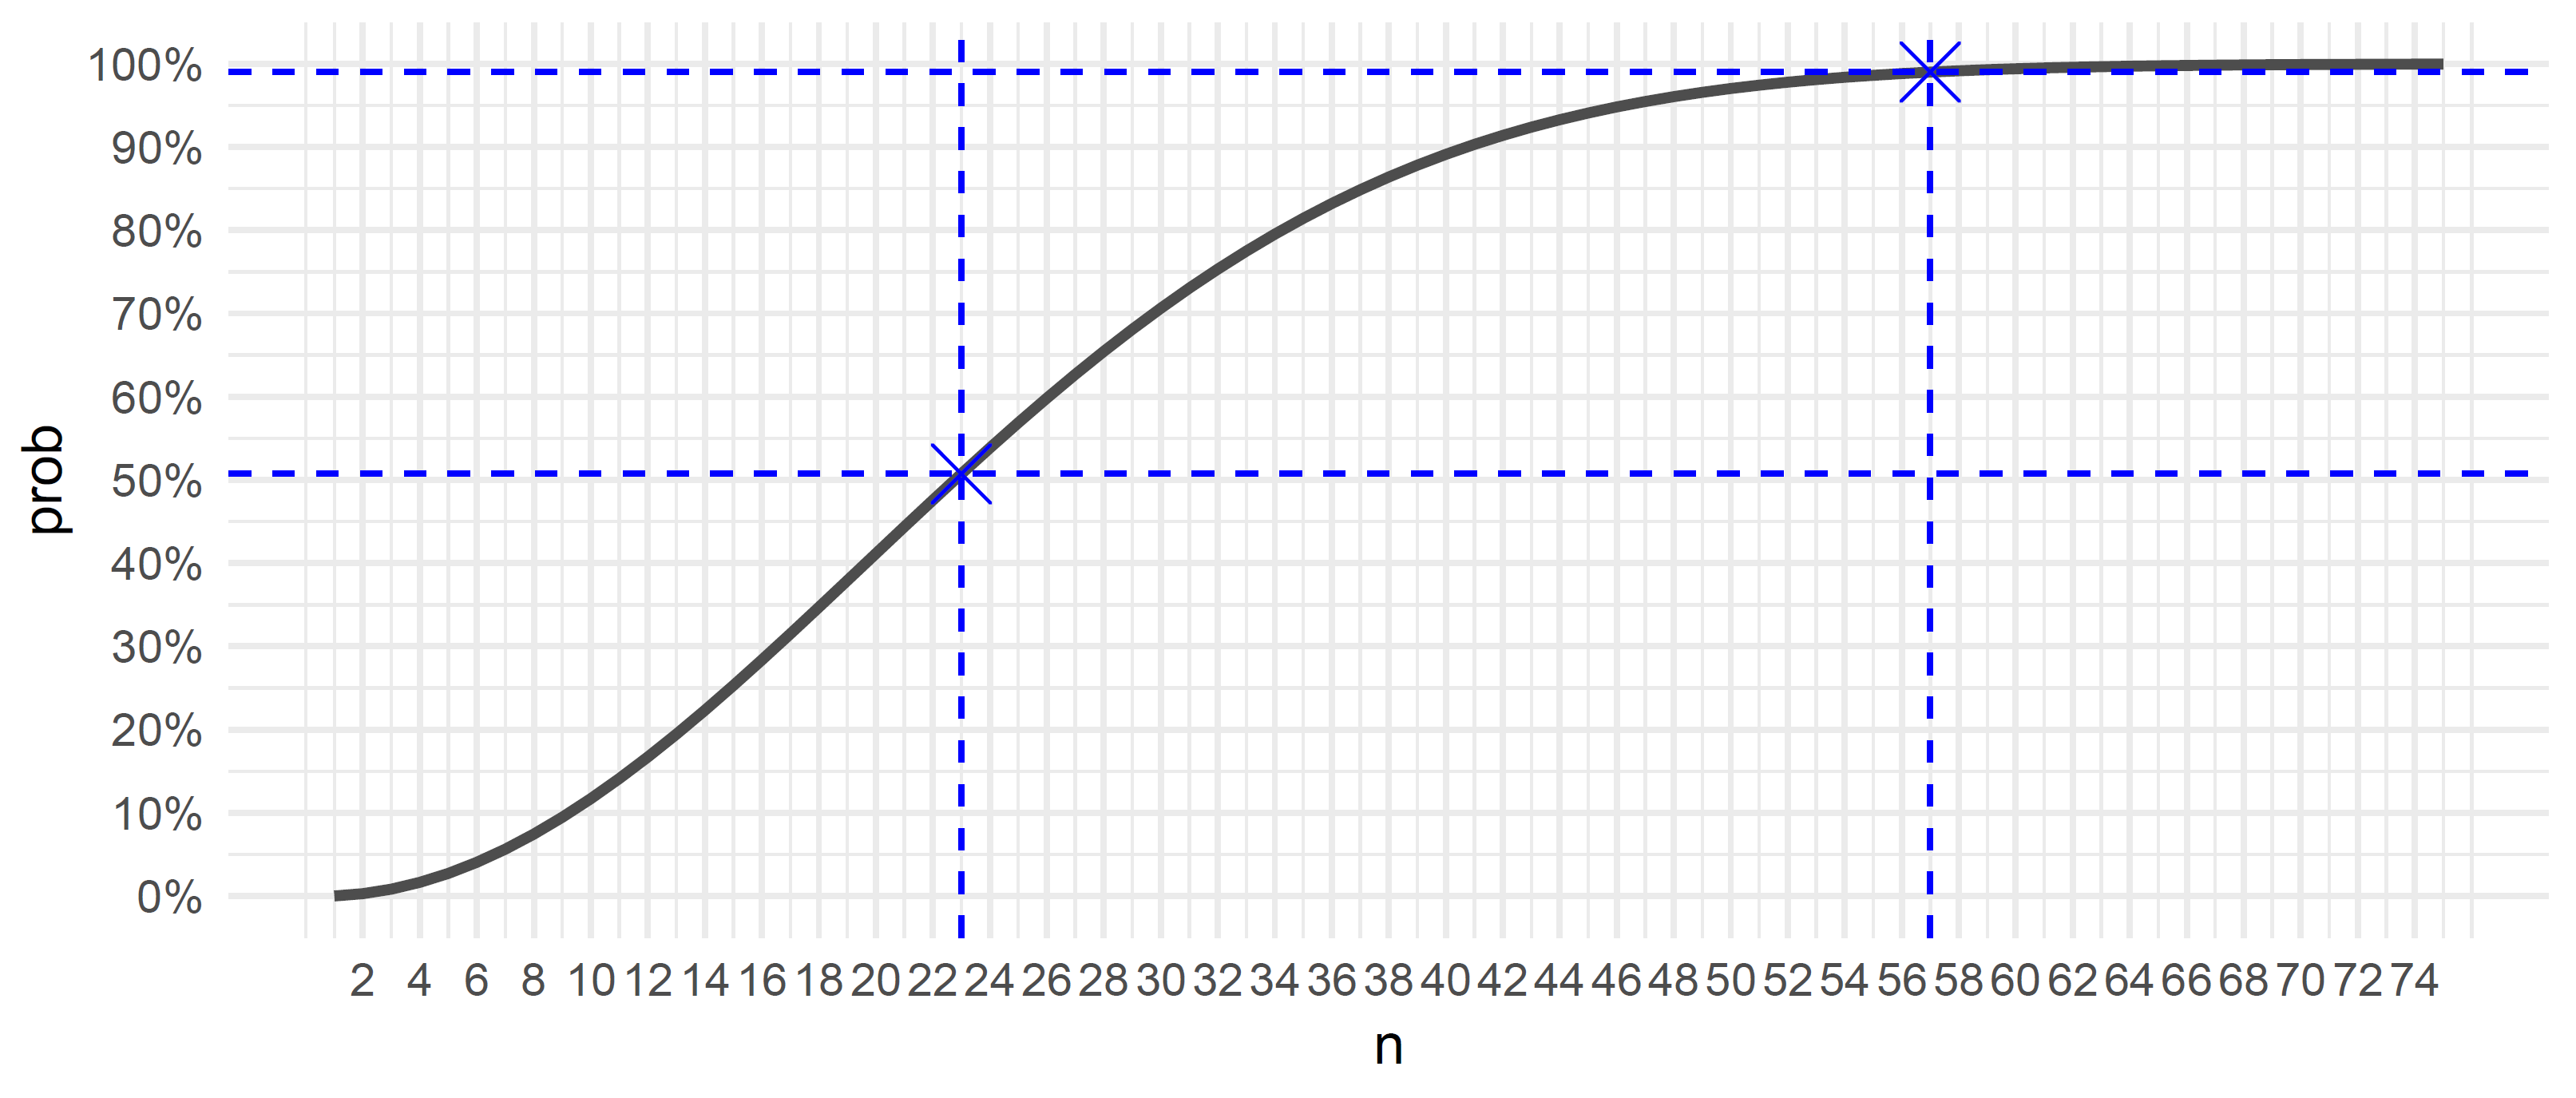
So, in a group of 23 people1 the probability of two people sharing a birthday is 50.7%. I think most people unfamiliar with the problem would guess something below 10%.
- With some assumptions, e.g., that birthdays are uniformly distributed, but the violation doesn’t alter the main point. ↩︎
